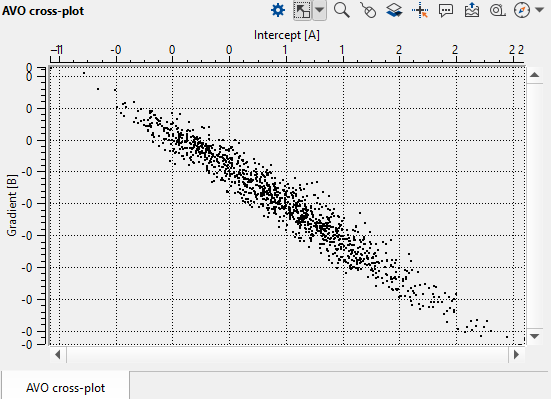
This scatter plot visualizes AVO data with the x-axis representing the intercept (amplitude at zero offset) and the y-axis representing the gradient (rate of change of amplitude with offset). It is used to quantitatively compare AVO responses from different locations or horizons on a common scale, making it easier to identify data clusters that may indicate specific lithologies or fluid types.
The newly created view will appear in the View manager in the active Workspase. User can place AVO cross-plot view by dragging it to any workspace except pre-defined once (Seismic data and Well data).
To define the object visibility stile go to the Visual Settings by pressing ![]() in the view functional panel or find it in the panel sets.
in the view functional panel or find it in the panel sets.
Functional panel allows user to perform the following actions:
![]() open Visual Settings panel
open Visual Settings panel
![]() adjust view area to all visible objects
adjust view area to all visible objects
![]() set/unset zoomable
set/unset zoomable
![]() set control item
set control item
![]() add Object
add Object
![]() enable mouse tracker
enable mouse tracker
![]() enable tool tip
enable tool tip
![]() export picture
export picture
![]() ruler tool
ruler tool
![]() show compass
show compass
![]() show minimap
show minimap
![]() show scale bar
show scale bar