This tool graphically represents Amplitude Versus Offset (AVO) data, displaying the relationship between reflection amplitude and offset for selected data points, helping to identify potential hydrocarbon indicators, lithology variations, or fluid content. Users can interactively adjust parameters, filter data points, and apply color-coding or clustering to enhance the analysis.
Aki-Richards Approximation Lines
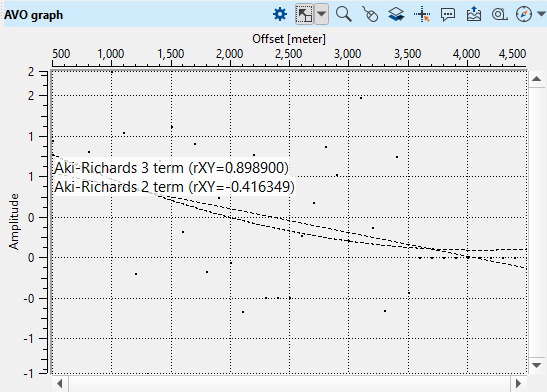
Two approximation curves are overlaid on the data points to model the expected AVO response:
1.Aki-Richards 2-Term Approximation: This line uses the first two terms of the Aki-Richards equation, focusing on the intercept and gradient. It provides a simpler approximation that emphasizes the general trend of amplitude variation with offset.
oCorrelation coefficient (rXY): The value displayed here (e.g., -0.416349) represents the correlation between the observed data points and the 2-term approximation, indicating how well this simpler model fits the data.
2.Aki-Richards 3-Term Approximation: This line incorporates an additional curvature term, offering a more detailed fit by considering higher-order effects significant at larger offsets.
oCorrelation coefficient (rXY): This value (e.g., 0.898900) indicates the correlation between the observed data and the 3-term model, showing an improved fit with this additional term for higher accuracy in complex cases.
Notes
•Use the 2-term approximation to get a quick estimate of amplitude trends, especially when analyzing data with smaller offsets.
•Apply the 3-term approximation for datasets with a broader range of offsets or when high accuracy is required, as it captures more subtle effects related to rock properties and fluid content.
The newly created view will appear in the View manager in the active Workspase. User can place AVO graph view by dragging it to any workspace except pre-defined once (Seismic data and Well data).
To define the object visibility stile go to the Visual Settings by pressing ![]() in the view functional panel or find it in the panel sets.
in the view functional panel or find it in the panel sets.
Functional panel allows user to perform the following actions:
![]() open Visual Settings panel
open Visual Settings panel
![]() adjust view area to all visible objects
adjust view area to all visible objects
![]() set/unset zoomable
set/unset zoomable
![]() set control item
set control item
![]() add Object
add Object
![]() enable mouse tracker
enable mouse tracker
![]() enable tool tip
enable tool tip
![]() export picture
export picture
![]() ruler tool
ruler tool
![]() show compass
show compass
![]() show minimap
show minimap
![]() show scale bar
show scale bar