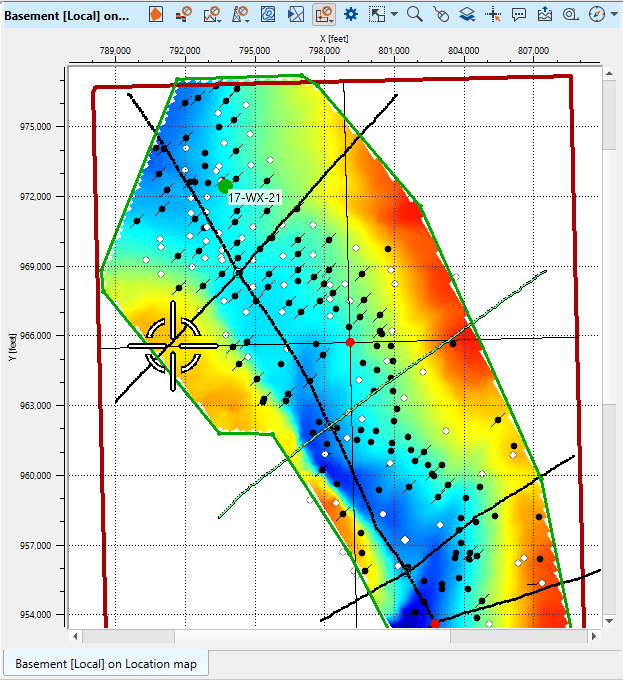
The Location Map is a window that allows users to display and manage loaded GIS-type data, including seismic, well data geometry, polygons, arbitrary lines, maps, horizons, and more.
The Location Map view consists of a map canvas with a coordinate frame and a functional panel at the top of the view.
To create location map view go to the Views bar in the Ribbon bar and click on Location map button. It has two options: create blank location map and create location map with objects added:
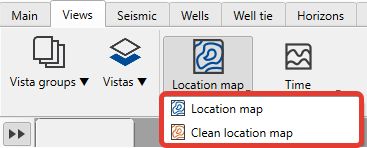 .
.
The newly created view will appear in the View manager in the active Workspase. User can place location map view by dragging it to any workspace except pre-defined once (Seismic data and Well data).
To define the object visibility style go to the Visual Settings by pressing ![]() in the view functional panel or find it in the panel sets.
in the view functional panel or find it in the panel sets.
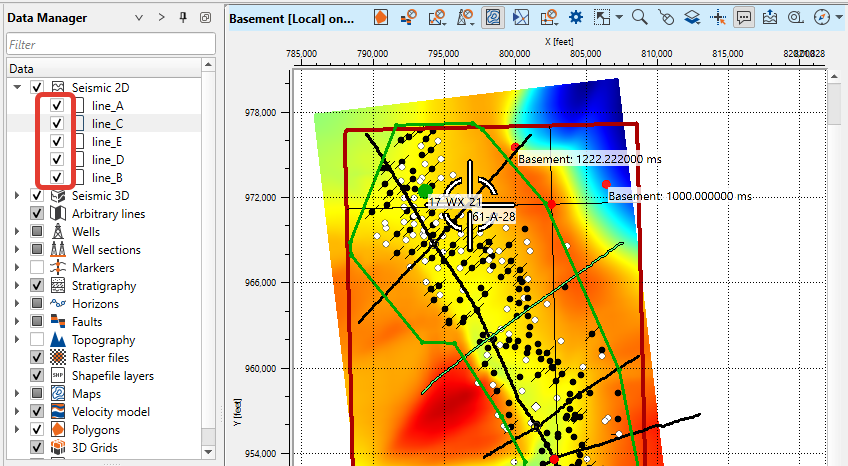
On the Location map view user can visualize any object with coordinates. To visualize the object press its checkbox in the Data manager.
Functional panel allows user to perform the following actions:
![]() edit polygon
edit polygon
![]() edit fault
edit fault
![]() edit 2D arbitrary line
edit 2D arbitrary line
![]() edit 3D arbitrary line
edit 3D arbitrary line
![]() current well on map
current well on map
![]() edit well section
edit well section
![]() edit checkpoints
edit checkpoints
![]() select intersection
select intersection
![]() select 2D/3D/image bin
select 2D/3D/image bin
![]() open Visual Settings panel
open Visual Settings panel
![]() adjust view area to all visible objects
adjust view area to all visible objects
![]() adjust horizontal scale
adjust horizontal scale
![]() adjust vertical scale
adjust vertical scale
![]() set/unset zoomable
set/unset zoomable
![]() set control item
set control item
![]() add Object
add Object
![]() enable mouse tracker
enable mouse tracker
![]() enable tool tip
enable tool tip
![]() export picture
export picture
![]() ruler tool
ruler tool
![]() show compass
show compass
![]() show minimap
show minimap
![]() show scale bar
show scale bar
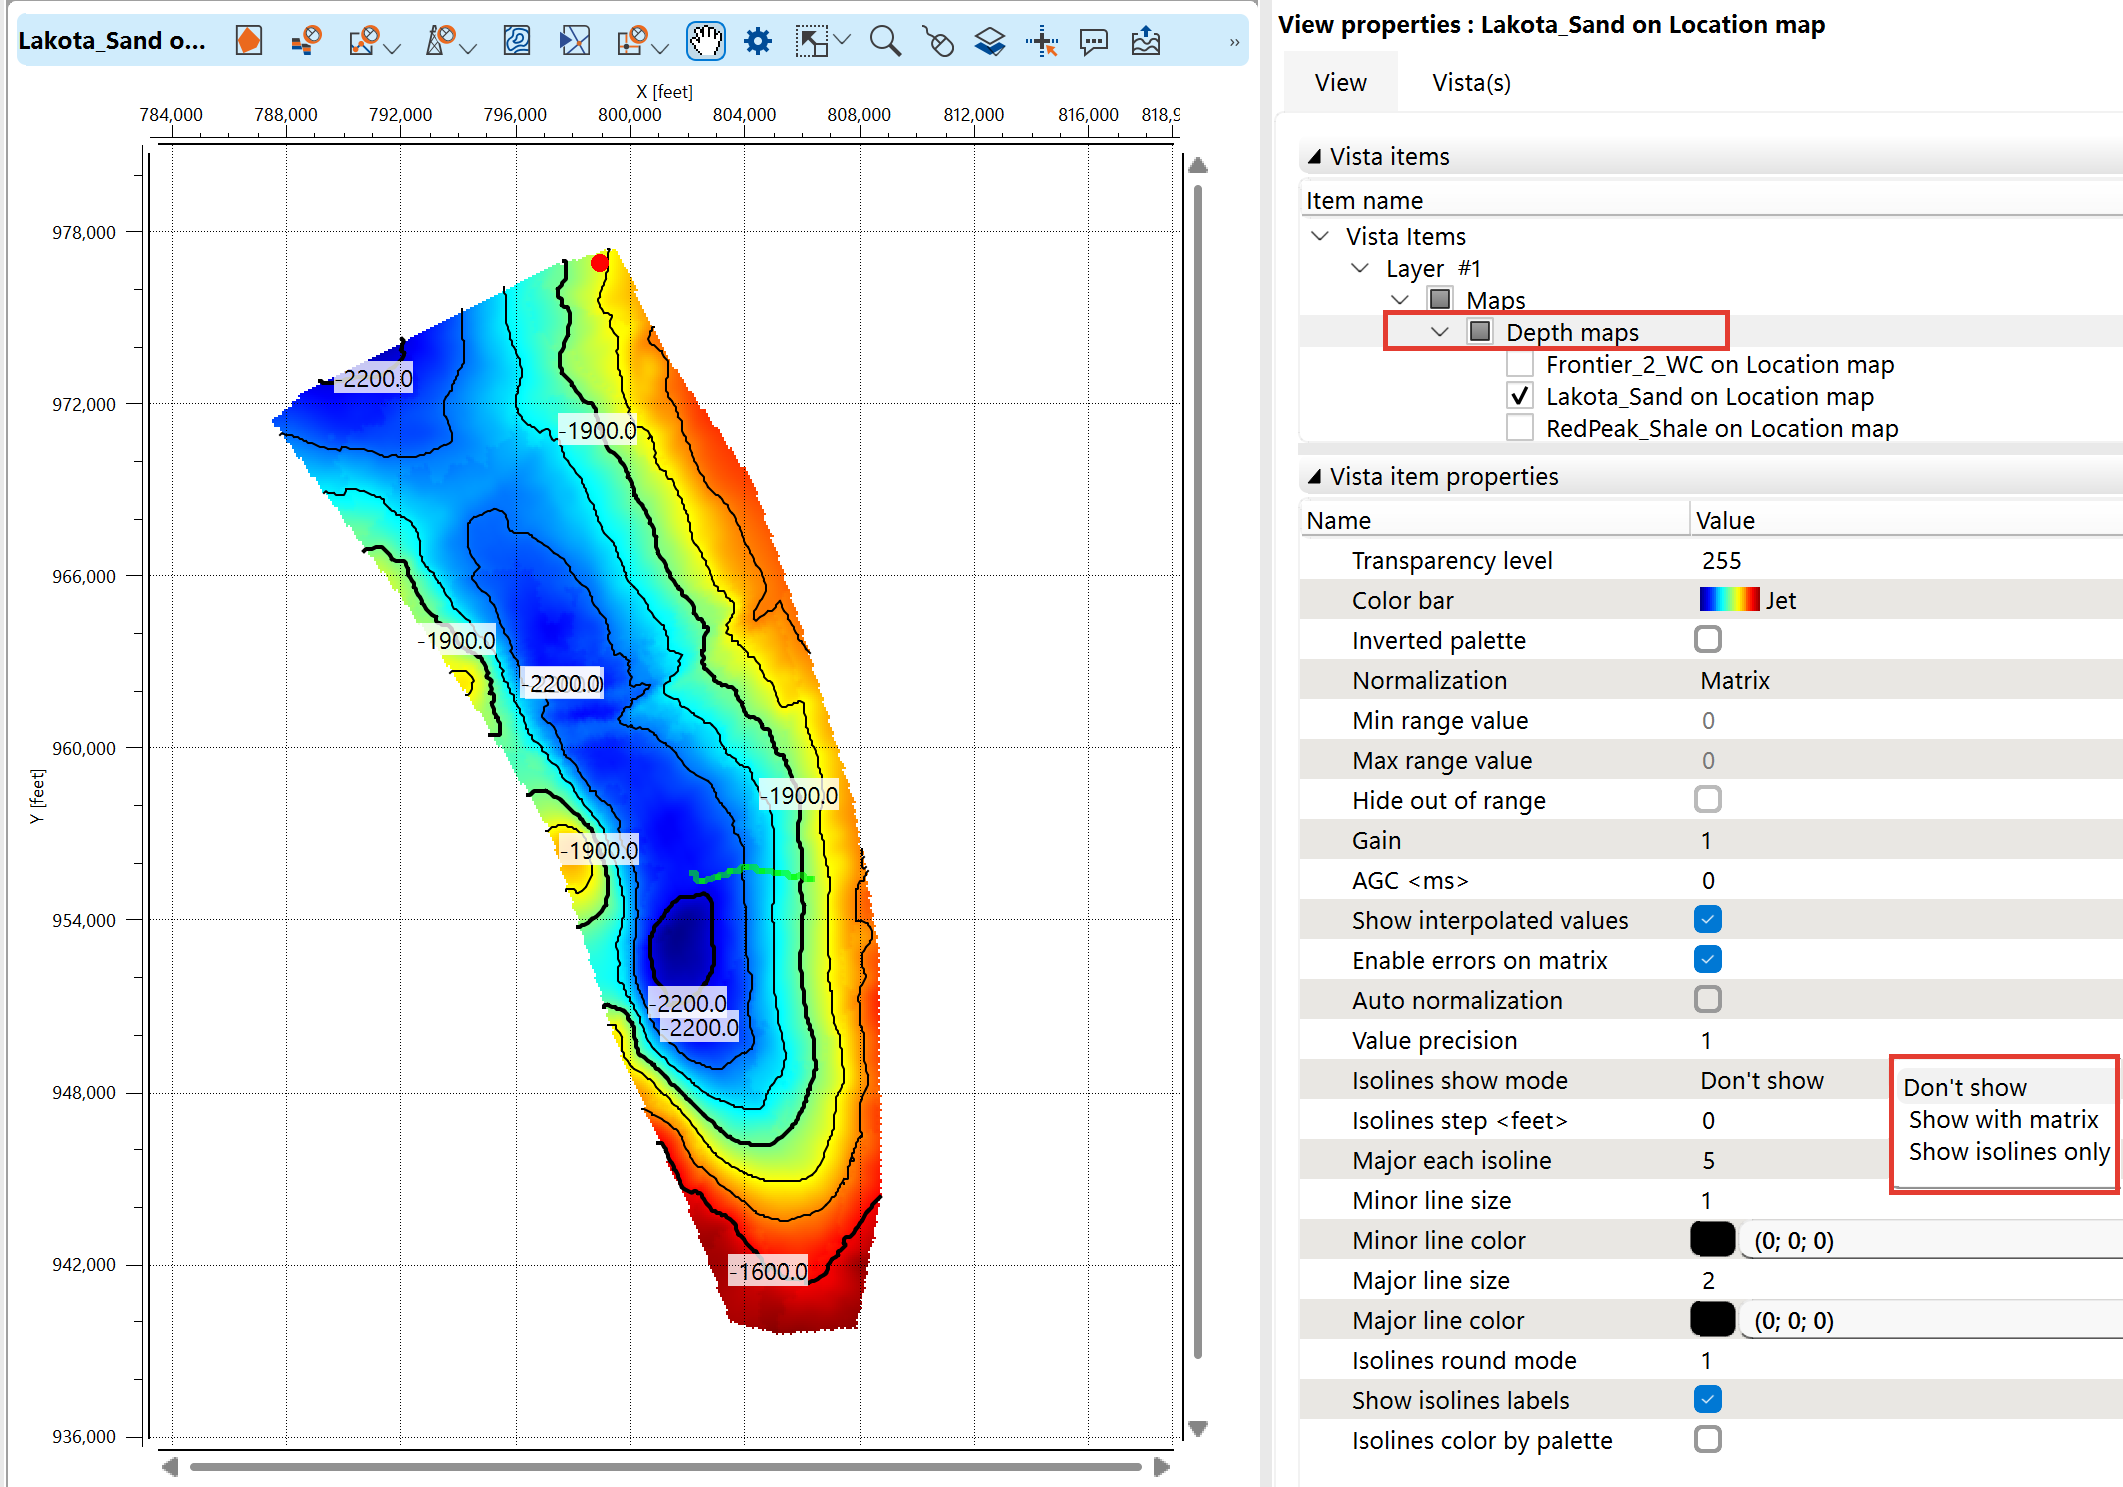
Object Item Properties Overview
Transparency Level
•Adjusts the transparency of the displayed map.
•Range: 0 (fully opaque) to 255 (fully transparent).
Color Bar
•Defines the color scale applied to the map.
Inverted Palette
•Reverses the color gradient of the selected color bar.
Normalization
•Defines how data values are normalized for color mapping.
•Options include Matrix (based on grid values).
Min/Max Range Value
•Allows users to manually set the minimum and maximum values for the color scale.
Hide Out of Range
•If enabled, values outside the defined range are hidden instead of clamped to min/max values.
Gain
•Adjusts the brightness of the map, affecting contrast between colors.
AGC (Automatic Gain Control)
•Affects amplitude scaling by normalizing the dynamic range.
•Measured in milliseconds.
Show Interpolated Values
•Enables the display of interpolated values in between original grid points.
Enable Errors on Matrix
•Highlights areas where the data matrix has inconsistencies or missing values.
Isoline Settings
Isolines Show Mode
•Controls the visibility of contour lines (isolines) on the map.
oDon't Show – No isolines are displayed.
oShow with Matrix – Isolines appear over the color-mapped grid.
oShow Isolines Only – Displays isolines without the underlying color matrix.
Isolines Step (Units: Feet or Meters)
•Defines the interval between adjacent isolines.
•A smaller value increases the density of isolines.
Major Each Isoline
•Defines how frequently a thicker major isoline appears (e.g., every 5th isoline).
Minor Line Size & Color
•Adjusts the thickness and color of minor isolines.
Major Line Size & Color
•Adjusts the thickness and color of major isolines.
Isolines Round Mode
•Controls rounding behavior of isoline values.
•A higher round mode reduces precision but simplifies contour labels.
Show Isolines Labels
•Enables or disables numerical labels on isolines.
Isolines Color by Palette
•If enabled, isoline colors match the underlying color map instead of using a fixed color.