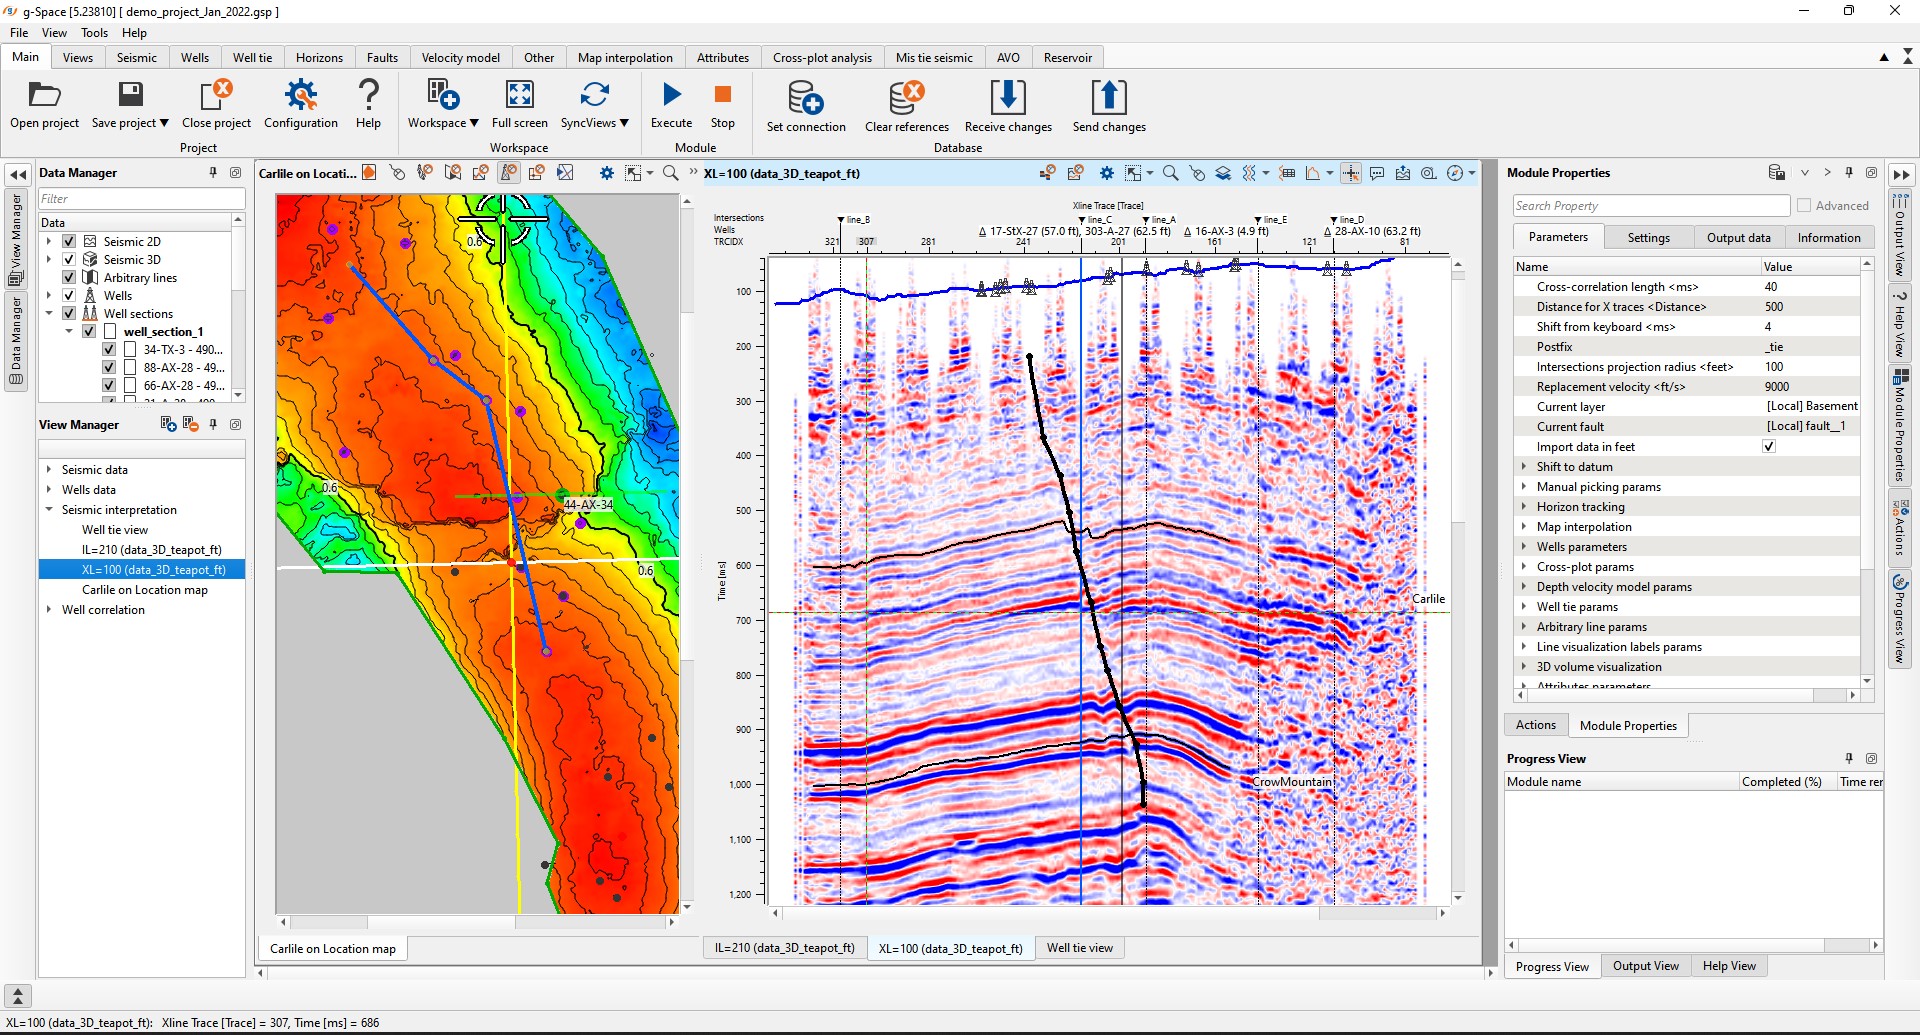
Seismic view is the set of section view windows where user can visualize seismic data and additional information such as grids, wells, markers, horizons, faults etc.
To create seismic section view go to the Views bar on the Ribbon bar and:
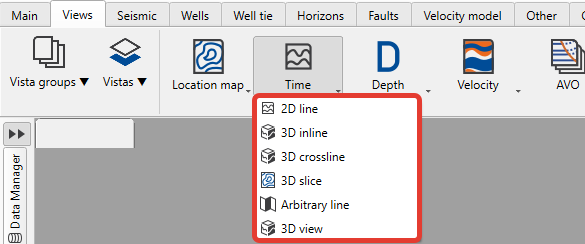
to create view in time domain open Time tab and choose between views: 2D line (for 2D data), 3D inline/crossline (for 3D data) or arbitrary line (for both 2D and 3D):
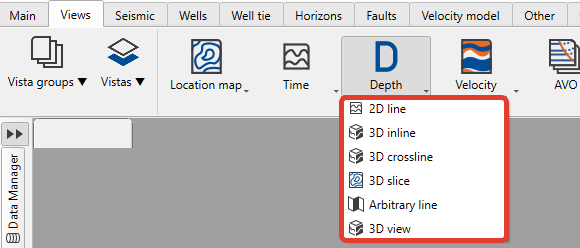
to create view in depth domain open Depth tab and choose between views: 2D line (for 2D data), 3D inline/crossline (for 3D data) or arbitrary line (for both 2D and 3D):
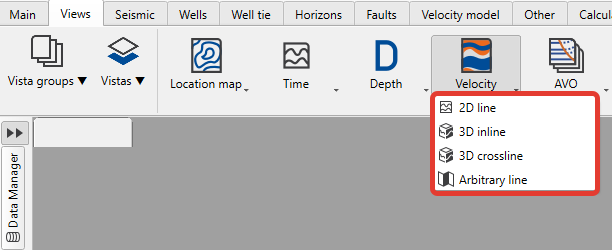
to create view for velocity data open Velocity tab and choose between views: 2D line (for 2D data), 3D inline/crossline (for 3D data) or arbitrary line (for both 2D and 3D):
The newly created view will appear in the View manager in the active Workspase. User can place Views by dragging them to any workspace except pre-defined once (Seismic data and Well data).
To define the object visibility stile go to the Visual Settings by pressing ![]() in the view functional panel or find it in the panel sets.
in the view functional panel or find it in the panel sets.
To visualize seismic data on the seismic section view make the loaded survey active by double click on it in the Data manager.
Additional information about seismic visualization you can find here.
Functional panel allows user to perform the following actions:
![]() faults picking
faults picking
![]() horizons picking
horizons picking
![]() open Visual Settings panel
open Visual Settings panel
![]() adjust view area to all visible objects
adjust view area to all visible objects
![]() adjust horizontal scale
adjust horizontal scale
![]() adjust vertical scale
adjust vertical scale
![]() set/unset zoomable
set/unset zoomable
![]() set control item
set control item
![]() add Object
add Object
![]() select traces
select traces
![]() trace data
trace data
![]() spectral analysis tool - multi selection
spectral analysis tool - multi selection
![]() spectral analysis tool - single selection
spectral analysis tool - single selection
![]() enable mouse tracker
enable mouse tracker
![]() enable tool tip
enable tool tip
![]() export picture
export picture
![]() ruler tool
ruler tool
![]() show compass
show compass
![]() show minimap
show minimap
![]() show scale bar
show scale bar