Band-Pass Analysis
The Band-Pass Analysis feature in g-Viewer enables users to analyze the frequency spectrum of seismic data by selecting specific areas within a dataset.
Multiple Selections Within a Single Seismic Dataset enables users to select multiple regions within a single seismic dataset for spectrum analysis.
Workflow:
- Open a seismic dataset in g-Viewer.
- Activate the Band-Pass Analysis tool at the top of the view
- Select multiple regions of interest within the seismic data using left mouse button
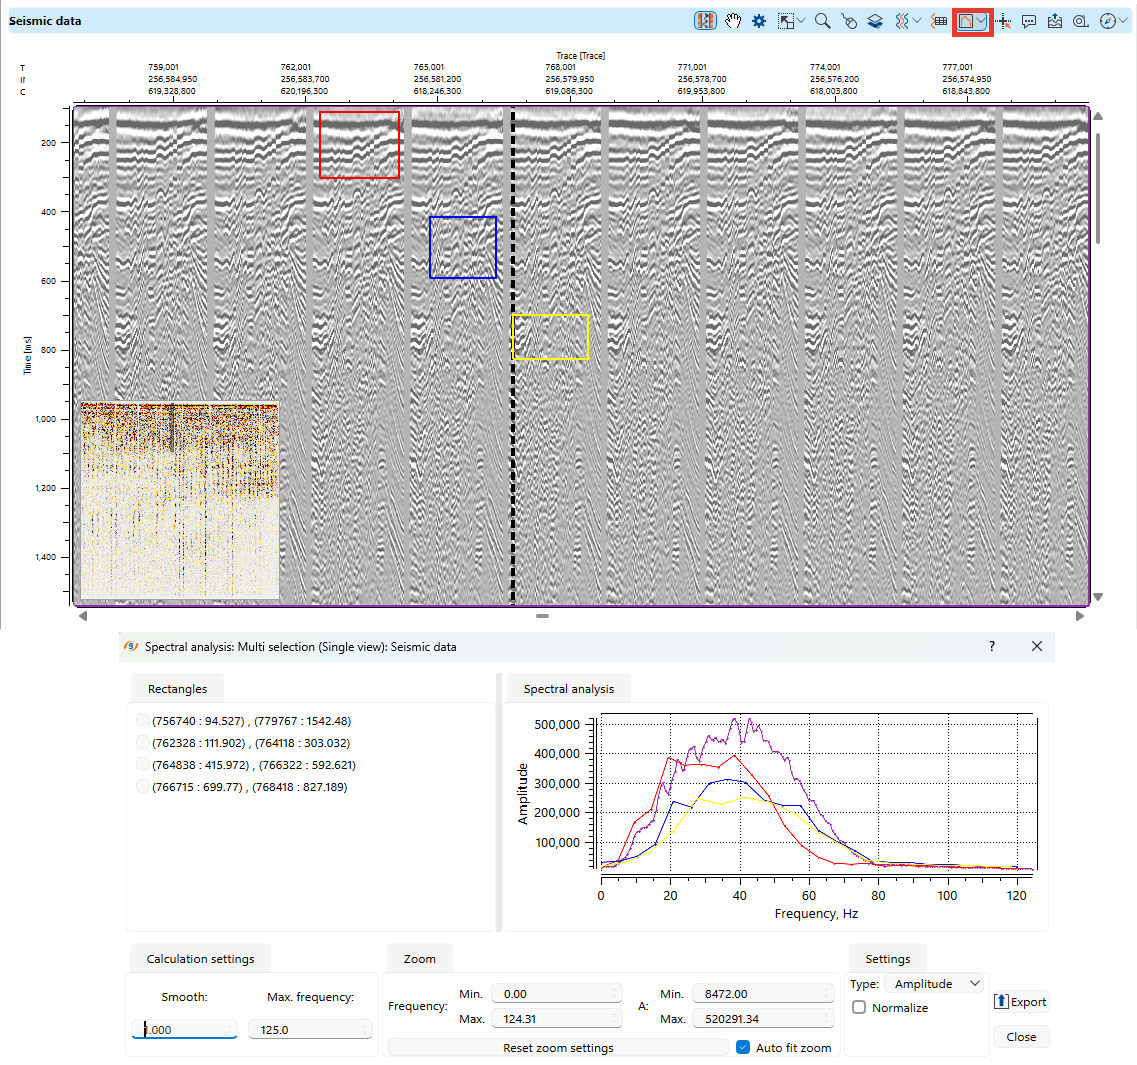
- Each selected region will be analyzed, and its corresponding frequency spectrum will be plotted
Spectral Analysis Panel
Once selections are made, the spectral analysis panel displays:
- The list of selected regions.
- The computed amplitude spectrum for each selection.
- The option to change color, the same color will be highlighted a rectangle on Seismic data view and show spectrum plot
- Options to adjust frequency smoothing and zoom settings.
- Export functionality for saving results.
Calculation Settings
- Smoothing: Adjusts the level of spectral smoothing.
- Max Frequency: Defines the upper limit of the analyzed frequency range.
Zoom & Display Options
- Users can zoom into specific frequency ranges.
- The "Auto fit zoom" feature optimizes the view for better visualization.
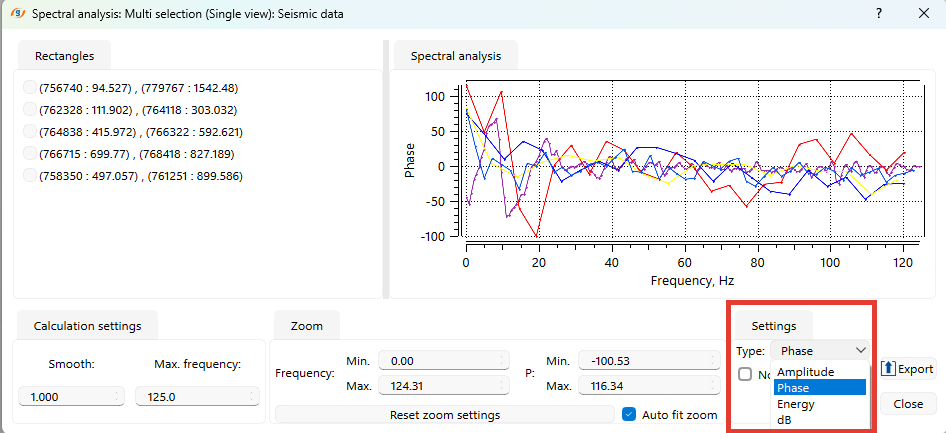
Users can analyze the frequency spectrum using different types of spectral analysis:
- Amplitude: Displays the amplitude of each frequency component.
- Phase: Shows the phase shift of each frequency component.
- Energy: Represents the energy distribution across frequencies.
- dB: Provides a decibel scale representation of spectral content.