LAS log and correlation views
The LAS workspace window holds two well-log views: the LAS log view for the current well and the LAS correlation view for several wells side by side.
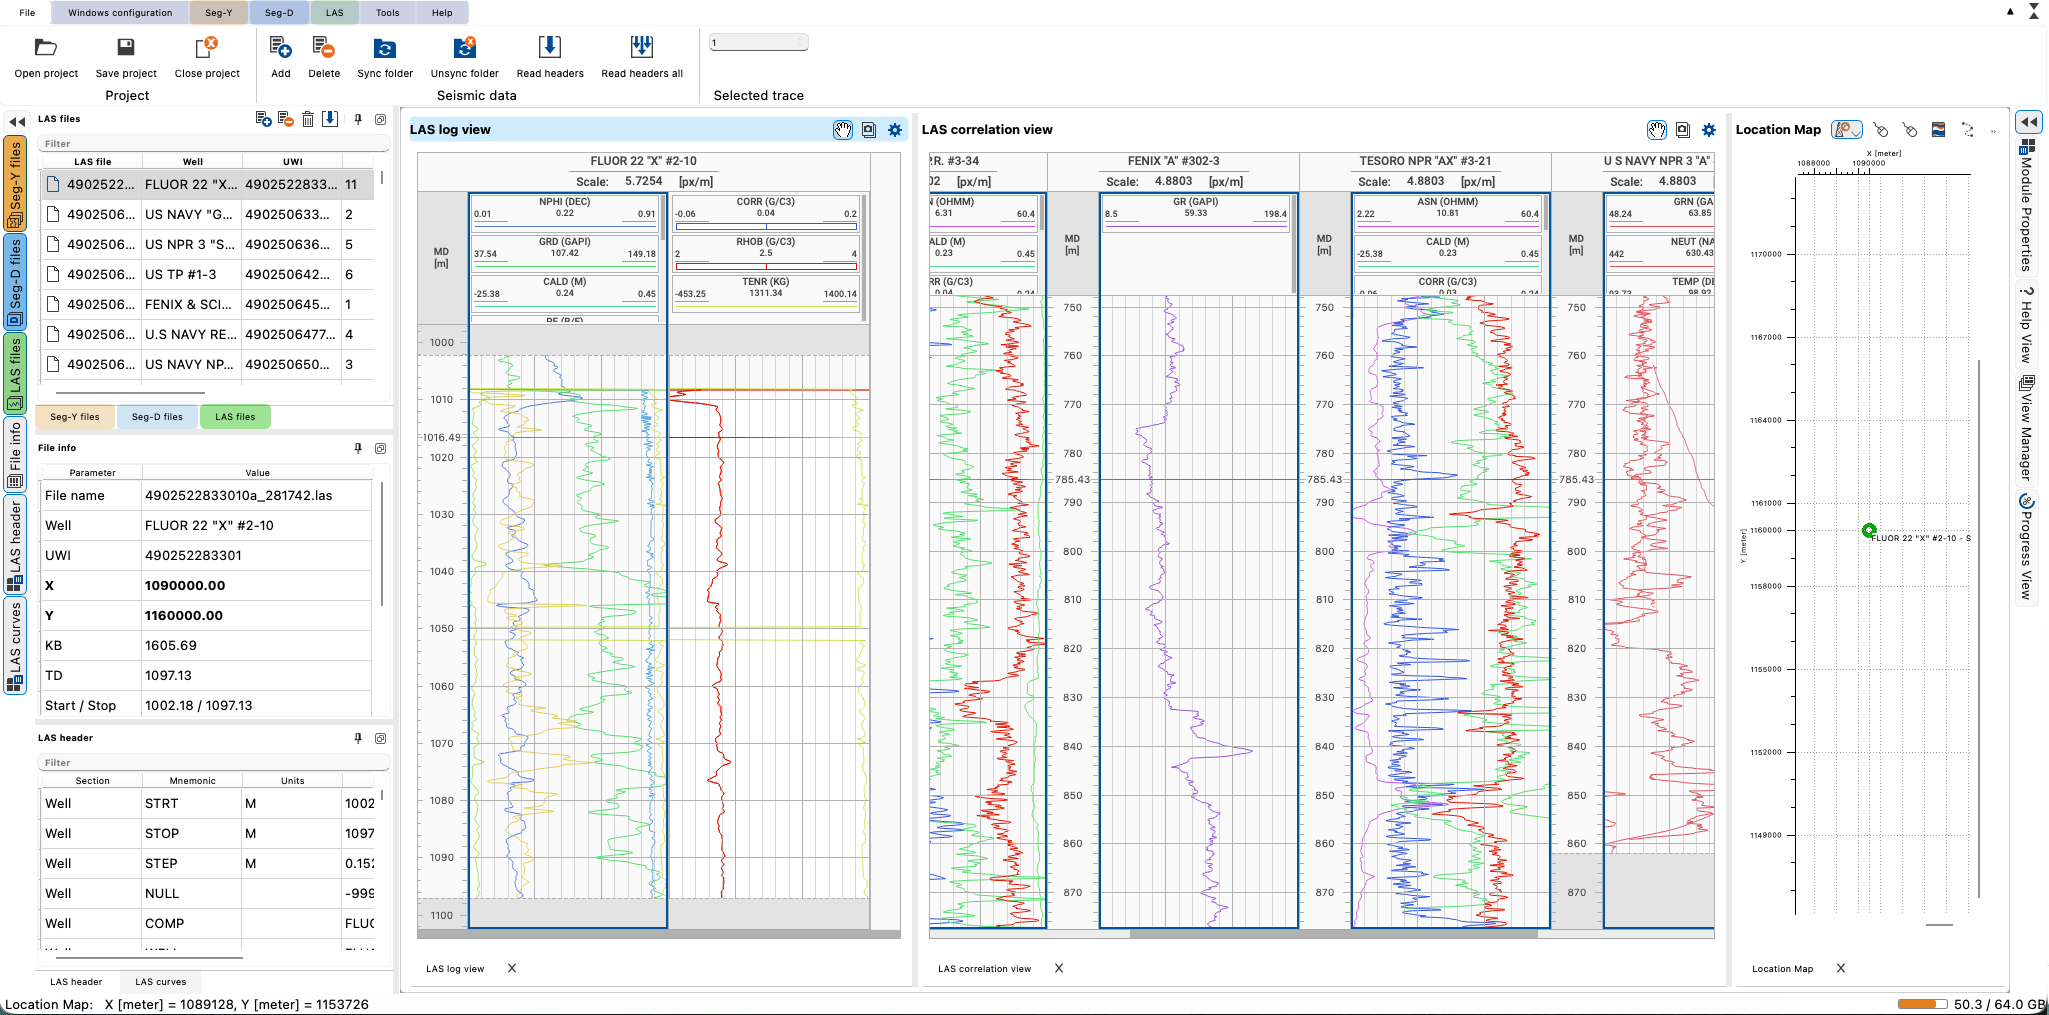
LAS log view
Shows the tracks and curves of the well selected in the LAS files panel.
LAS correlation view
- Add wells with Add to LAS correlation view in the context menu of the LAS files panel, and remove them with Remove from LAS correlation view.
- In the Curves log mode the view shows only the picked curve, in every well.
- Scroll through the wells with the horizontal scroll bar.
- The layout of the view is saved in the project.
View properties
- Relative Well Distance - when on, the gap between wells follows the real distance between them (Pixels Per Meter × distance). It is off by default because LAS wells often have no coordinates; turn it on after the coordinates are set (in the LAS file, by header Import or in File info).
- Units Type, Pick Mode, Depth On Hover and the other display settings.
- Zones Transparency (%) - 0% is opaque. All transparency values in the view properties are in percent.
The tool bar of the views has the Hand and Capture tools and the view properties. Markers and the Markers axis are not available in g-Viewer.
Track settings
In the track settings, each group (for example Curves and Curves (arrays)) has one switch that shows or hides all items of the group. The switch is dimmed when only some items are on.
Curve colours
A curve keeps the same colour in every LAS view and in every track. The colour comes from, in order:
- the well-log template;
- a colour you set (Set color or a colour picked in a view, which then applies to that curve in all views);
- an automatic colour from the log type of the curve (for example RHOZ gets the Density colour), or from the curve name. Colorize on the LAS tab assigns these colours to all curves.
Save a layout as a template with Template / Manage on the LAS tab.
Logs and seismic
LAS logs are not displayed on seismic sections in g-Viewer. To see the wells together with seismic data, use the 3D view: the wells are drawn there, coloured and sized by the curves chosen in Wells visualization on the LAS tab, and placed in time with Velocity and Seismic datum.
See Also