Wells bar allows to import/export/delete well data of the project
For more information about the formats supporting by g-Space please refer to chapter Well Data Formats
Consists of the following sections: Views, Log mode, Headers, Markers, Checkshots, Well inclinometry, LOG, Comments, Calculator, Wells visualisation and Templates
Views section:
 Open predefined wells data workspace
 Workspace - arrow button allows to switch between existing workspaces. Main button of the combobox allows to create a new empty workspace
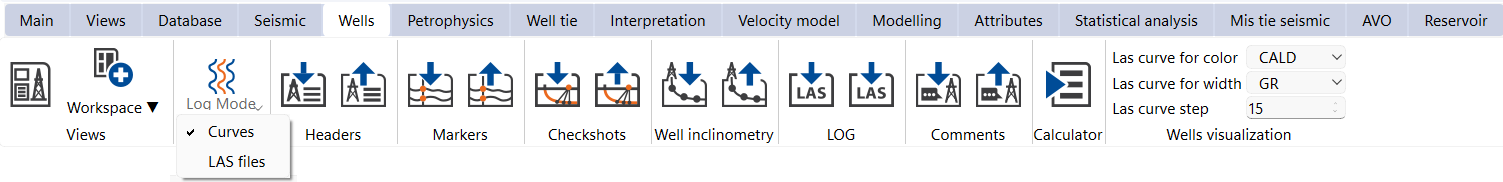
Log mode section:
Log Mode - a drop-down that controls how logs are displayed in the Data Manager, switching between two modes. In Curves mode (the default) logs are shown as individual curves; in LAS files mode logs are grouped by the original imported LAS file.
Headers section:

 Import / Export / Clear Headers - operations on well headers information
Markers section:

 Import / Export - operations on well markers data
Checkshots section:


 Import / Export - operations on time-depth relationship data within each well
Well inclinometry section:


 Import / Export - operations on well deviation information
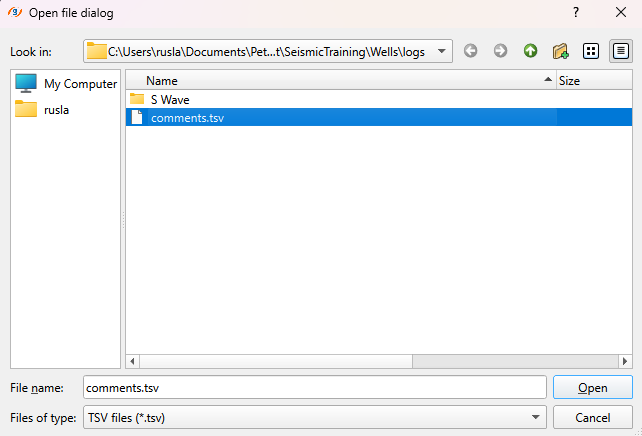
LOG section:
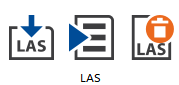 Load LAS files / Log Loading Wizard - operations on well log data
Comments section:


 Import / Export - operations on well log data
Calculator section:
Marker attributes calculator - opens the calculator used to derive attributes from well markers (for example thickness or depth differences between markers). See also Working with Markers.
Wells visualisation section:
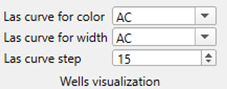
Settings for 3D visualization
It contains three options:
1.Las curve for color: A drop-down menu where the user can select a LAS curve color.
2.Las curve for width: A drop-down menu where the user can select a LAS to define the width of the Log curve in the 3D view.
3.Las curve step: A numeric input field set to 15, which specifies the step value for the log data used for visualization.
Templates section:
Select template - a drop-down that selects the view template applied to the wells workspace.
Note: Clear actions (Clear LAS files, Clear checkshot, Clear wells, Clear markers) are available on the Data Manager right-click (context) menu, not on the ribbon.