Object
The Object(s) tab lets you set the visibility, order, and appearance of all objects in the active view.
It is divided into two sections: Object items and Object item properties
Object items - allows you to turn on/off visibility of the objects on the view. This is dynamic part of the window and shows the items according to the active view
You can re-order the layers  , turn on/off visibility of all objects
  and switch between working modes
  on the current view. The available Object items depend on the view and loaded data and can include Fault picks, Horizon picks, 2D Seismic time, Converted 2D Seismic time, 2D Seismic depth, Converted 2D Seismic depth, Inline time, Crossline time, Inline depth, or Crossline depth.
The Hide empty objects toggle in the Object items header (turned on by default) hides objects that have no items on the current view.
Additionally you can filter Object items by current object type in data manager  (turned on by default). To do so here the general flow in few steps:
1. Open Visual Settings panel (by opening the panel bar or using  button)
2. Select Filter by Data manager .
3. In Data Manager, select the type of object you want to manage.
After that in the Visual Settings you will get Object items for only the objects you selected in Data Manager:
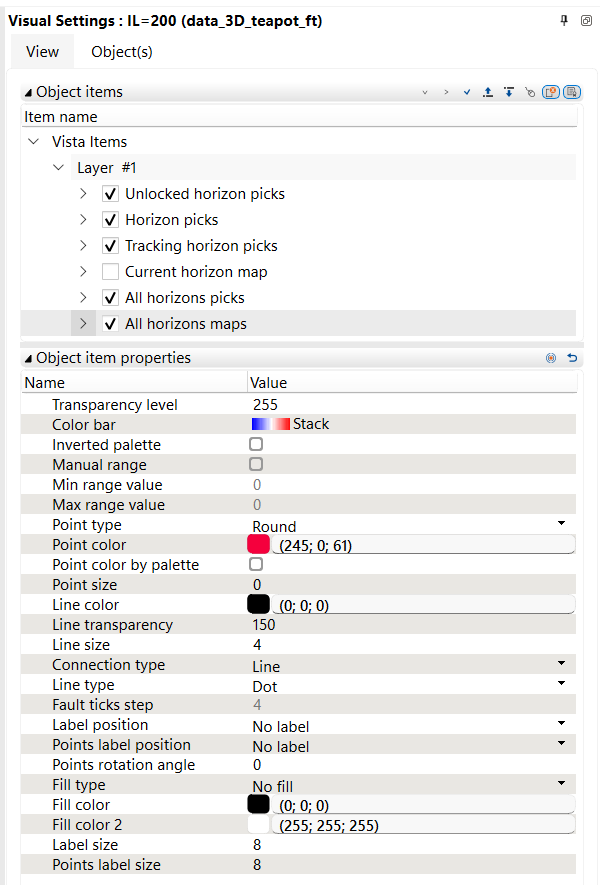
Object item properties section gives access to settings of selected object in the Object items section.
The settings list may vary depending on the active item type
Here is the list of the settings you can make for the active item (it may not be complete and depends on the active item type):
- Transparency level - set the opacity level of the item
- Color bar - allows to select a color bar
- Inverted palette - inverts a color bar
- Normalization - allows to select the source for color range
- Manual range - enables user-defined minimum and maximum range values
- Min range value - sets the lower value for user-defined normalization
- Max range value - sets the upper value for user-defined normalization
- Hide out of range - hides values outside the selected range values
- Gain - allows to choose gain for the visualization
- AGC <ms> - allows to set AGC
- Density - displays the item as a variable-density plot
- Wiggle - displays the item as wiggle traces
- Interpolated values type - sets how matrix values are interpolated for display: None, Bilinear (default) or Smooth
- Enable errors on matrix - enables display of error values stored with the matrix
- Auto normalization - automatically sets the color range from the data
- Value precision - set precision of the displayed data
- Isolines show mode - allow to turn on isolines
- Major each isoline - set the step of the bold isolines
- Minor line size - set thickness of minor isolines
- Minor line color - set color of minor isolines
- Major line size - set thickness of major isolines
- Major line color - set color of major isolines
- Isolines round mode - set isolines smoothing
- Show isolines labels - shows isolines values
- Isolines color by palette - set isolines color according the color bar
- Point type - set points style
- Point color - set points color
- Point color by palette - set points color according the color bar
- Point size - set points size
- Line color - set line color
- Line transparency - set opacity level for the line
- Connection type - set connection type for the points
- Line type - set line style (like solid, dashed, dotted etc.)
- Label position - set the label position
- Label color - set the color of the label, black by default
- Points label position - set the label position for the points
- Points rotation angle - set the points rotation
- Fill type - allow to fill the object
- Fill color - set the first filling color
- Fill color 2 - sets the second fill color
Color range of 3D seismic sections
When an inline or crossline section of a 3D seismic amplitude or attribute volume is shown in a view, its color range is taken from the whole volume and not from the current section. For such an item Normalization is set to User Defined, Manual range is turned on, and Min range value and Max range value hold the minimum and maximum of the entire volume. Amplitudes therefore stay comparable when you move from one section to another and between inline and crossline sections.
This range is set when the section is first displayed. If you afterwards choose your own Normalization or range values, they are kept when you move to another section.
Setting the symbol of a single well
A collection listed in the Object items section can be expanded to the individual objects it contains - for example the separate wells inside Wells on map. Select one of these individual items to edit its own settings in the Object item properties section.
To give one well its own symbol, expand the collection, select the well, and set the required Point type. A symbol set this way belongs to that well alone: it is kept when the symbol of the collection or group the well belongs to is changed afterwards, and it is stored with the project.
Shapefile objects grouped by source file
Objects loaded from shapefiles are listed in the Shape folder of the Object items section, under Points from ShapeFiles, Lines from ShapeFiles and Polygons from ShapeFiles.
Each of these groups is divided by source file. Expand a group to get one node for every loaded file that contains that geometry type, named after the file, and expand a file node to reach the individual objects that came from it. A file that holds several geometry types appears under every group it applies to, and a group lists only the files that actually contribute objects of that type.
Clearing the checkbox of a file node hides all objects of that geometry type that came from that file, and selecting it shows them again. The checkbox of the geometry group still controls all matching objects from all loaded files, and the appearance of a single object is still set by selecting it under its file node.
Two loaded files with the same name are kept apart, each with its own node. Settings stored for individual shapefile objects in projects saved before this grouping was introduced are kept when the project is opened again.
See Also