Well tie bar
Well tie bar provides interface to perform seismic to well tie

For more information about well tie functionality please refer to Well tie view
Consists of 4 sections: Views, Seismic, Synthetic, Cross-correlation
The Views section opens a predefined set of views arranged for the well tie workflow: the Well tie view and the Well tie cross-correlation view. See Well tie view.
The two views are added to the workspace that is active when you click the button. To build another set of well tie views, switch to another workspace or create a new one first and use the button there; you can keep several such sets in different workspaces.
If the well tie workspace itself is the active one, the button only brings it to the front and creates nothing, and if no well tie workspace exists yet, the first click creates it. Clicking the button again on a workspace that already holds these two views adds nothing - the views are not duplicated. A workspace that is still empty when you use the button takes the name Well tie window, while a workspace that already holds other views - a Location map, for example - keeps its own name.
In Seismic section it is possible to set seismic data for well tie.
Seismic Choose the line which is near by to the well
Seismic group Switch between different versions of loaded data
Nearest seis distance Set searching distance of seismic data around the well
Nearest seis width Set a number of traces in well tie view
The Seismic and Seismic group selections are stored for the selected well. Changing either drop down box saves that choice for the well selected at that moment, and when you select another well and come back, g-Space restores the seismic that well last used. The stored selections are saved with the project.
If a well has no stored selection yet, for example in a project saved before per-well selections were introduced, the selection currently shown is kept rather than reset. If the seismic stored for a well is no longer in the list for the current Nearest seis distance, the first entry in the list is selected.
Seismic in the Synthetic section (tooltip Save seismic trace to LAS) writes the near-well seismic trace of the well currently selected in the Well tie view - the middle trace of the gather selected by Seismic and Seismic group within Nearest seis distance, the trace shown beside the synthetic. It is converted from two-way time to measured depth with the checkshot of that well and saved as a per-well LAS curve named Seismic curve (amplitude) inside a LAS entry named SeismicLasCurve, which appears under that well in the Data Manager and in the well log views. The curve is indexed by measured depth (DEPT, in metres) on a regular depth step comparable to the synthetic curve, so you can review or export it like any other well log.
A well must be selected and must have a checkshot, a near-well gather must be found for the current Seismic and Nearest seis settings, and the Well tie tab requires the seismic interpretation licence. If a prerequisite is missing, nothing is written and no message is shown. Running the action again for the same well overwrites the curve in the same SeismicLasCurve entry instead of creating a second one.
In Synthetic seismogram section it is possible to set synthetic parameters:
Create Set inputs: Sonic, Sonic - density, Impedance
Sonic, Density, Impedance Drop down boxes allow you to choose the well logs
Synthetic seis width Set a width in well tie view
Well-tie template Stores all well-tie templates created in g-Space
Wavelet analysis Settings for the wavelet used for well-tie
Seismic Save the near-well seismic trace of the selected well as a well log
Save reflectivity curve to LAS Save the reflectivity series of the selected well as a well log
Save reflectivity curve to LAS writes the reflectivity series of the well currently selected in the Well tie view, computed from the same inputs as the synthetic seismogram. It is saved as a per-well LAS curve named Reflectivity curve inside a LAS entry named ReflectivityLasCurve, which appears under that well in the Data Manager and in the well log views. The curve is indexed by measured depth (DEPT, in metres) on a regular depth step, so you can review or export it like any other well log.
The well must have a checkshot and must already be set up for well tie, that is its well tie parameters must be stored, and the seismic interpretation licence is required. If a prerequisite is missing, g-Space shows an explanatory message - for example that the well has no checkshot - and saves nothing. Running the action again for the same well overwrites the curve in the same LAS entry instead of creating a second one, so versions do not accumulate.
In Cross-correlation section it is possible to set cross-correlation window parameters:
Start Set start of the analysis interval
End Set end of the analysis interval
Lag Set a width of plot in the cross-correlation view
The Start and End values are stored for the selected well. When you select another well and come back, g-Space restores the cross-correlation window you last set for that well, in the same way as the Seismic and Seismic group selections of the Seismic section and the Create, Sonic, Density and Impedance selections of the Synthetic seismogram section. The stored windows are saved with the project.
If a well has no stored window yet, or the project was created before per-well windows were introduced, the values currently shown are kept rather than reset. Of the Cross-correlation settings, only Start and End are stored per well: Lag and Consider only phase info are single settings shared by all wells.
Save calibrated T-D model
After you edit the checkshot anchors in the Well tie view, the Save calibrated T-D model action in the view toolbar saves the calibrated time-depth model for the selected well, built from the edited anchor positions.
Two LAS curves are written under the corresponding well in the Data Manager and shown in the Well tie view:
- TWT_calibrated - the calibrated two-way time curve (ms)
- Vint_calibrated - the calibrated interval velocity curve (m/s)
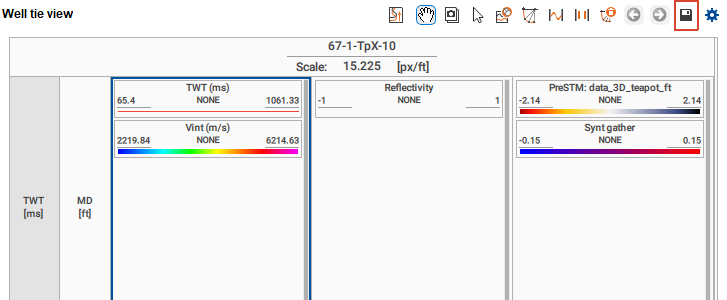
Save calibrated T-D model action (outlined) in the toolbar of the Well tie view. The action is shown for a single well and is not available in the Well correlation view.