Wellbore stability view
The Wellbore stability view predicts how a hole drilled in different directions would behave at one reference depth. Each point on the disc is a drilling direction, coloured by a selected stability result. The calculation uses a Mohr-Coulomb shear limit and a tensile limit.
Set up the graph
On the Views bar, open Graphs and choose Wellbore stability. On the Statistical analysis bar, choose Wellbore stability in Graph type. Select the Well, set Reference depth to the measured depth for the stress state, and choose Stress unit as MPa or psi.
For Sv, SHmax, Shmin, Pp and UCS, use each source control to enter a Manual value or choose Well curve and its curve. Curve values are read from the selected well at the reference depth. A missing curve or a depth outside its logged interval is reported instead of drawing a result for an unrelated value.
Set Azimuth source to Manual to enter SHmax azimuth, clockwise from north, or to Breakout picks to derive it from usable observations on the selected well. Set Friction mu and Poisson nu. Tensile strength can be Derived as UCS divided by 10 or Manual through T0; Mud pressure can be derived from Pp or entered through Pmud.
Use Colour by to select Breakout width, Collapse pressure, Breakdown pressure or Safe mud window. Acceptable width sets the breakout width tolerated at the collapse limit. Collapse pressure is the lower mud-pressure limit; breakdown pressure is the tensile upper limit; the safe mud window is the gap between them. For pressure results, Value unit offers psi, MPa or ppg. A ppg result requires a reference depth with positive true vertical depth. Projection offers Equal area (Schmidt) and Equal angle (Wulff).
Read the disc
The centre of the disc represents a vertical hole, the rim a horizontal hole, and compass bearing runs clockwise from north. The 30° and 60° inclination rings and the SHmax, Shmin and Sv markers orient the result. With Colour by set to Breakout width, the legend shows predicted breakout width in degrees for each direction, as in the example below.
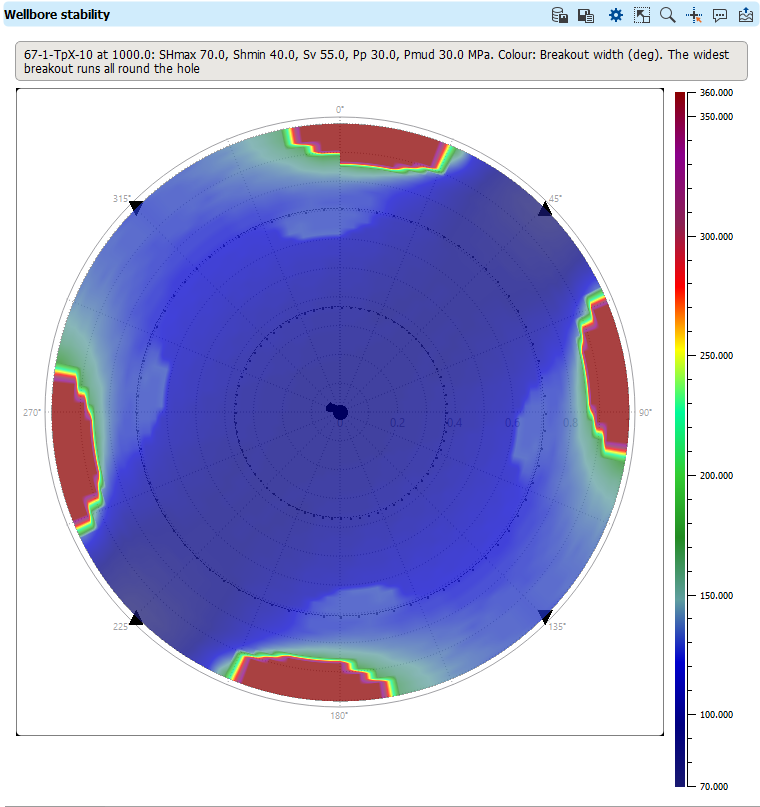
For pressure results, read the colour against the legend in the chosen value unit. In Collapse pressure and Safe mud window modes, grey directions have no safe mud weight under the selected limits; the view reports their count. The disc also states when the chosen mud pressure is below pore pressure.
Compare wells and observations
The selected well's deviation survey draws its trajectory across the disc. Observed breakout picks appear on that trajectory at their depths, with marker sizes grouped by recorded width, so their locations can be compared with the predicted field. Choose a Planned well to draw a second trajectory. Each overlay can be shown or hidden and styled separately in Visual Settings > Object(s). If a survey or usable breakout picks are absent, the overlay states why it is unavailable while the stability calculation remains available.
Click a direction inside the disc to pin it and inspect the wellbore cross-section for that direction.
Save the result
Right-click the plot and choose Save Wellbore stability to Data Manager... to keep a graph that can be reopened, or Save Wellbore stability picture to Data Manager... to keep an image of the disc.