Visualization seismic data stack cubes (in depth and time domains)
![]()
![]()
This module provides the visualization of 3D seismic cubes, including inlines, crosslines, and slices, offering an intuitive interface for seismic data analysis. Users can interactively explore the cube by selecting specific inlines and crosslines, allowing for a detailed examination of the seismic data at various depths/time and orientations. The stacked seismic cube is loaded directly into RAM for fast access and real-time manipulation. Additionally, the location map serves as an interactive visual element, enabling users to easily select and navigate between inlines and crosslines using the mouse, enhancing the overall data exploration experience.
![]()
![]()
Input gather - input 3D seismic stack-cube (gather in RAM).
![]()
![]()
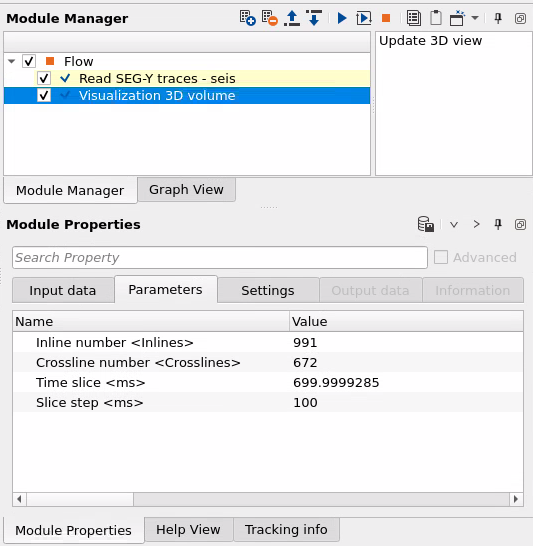
Inline number - define inline number for selection, or it will be automatically changed in case of using interactive selection (via mouse) on the Location map ->Selected bin XY:
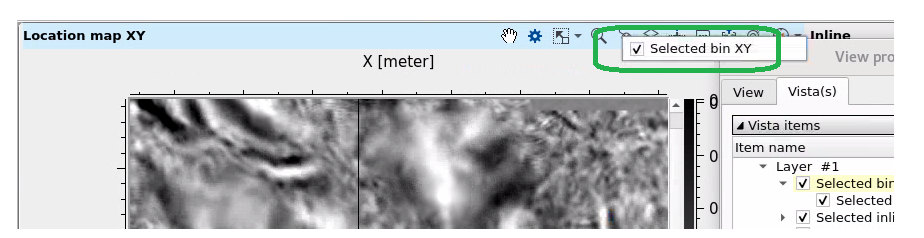
Crossline number - define xline number for selection,or it will be automatically changed in case of using interactive selection (via mouse) on the Location map as previous parameter.
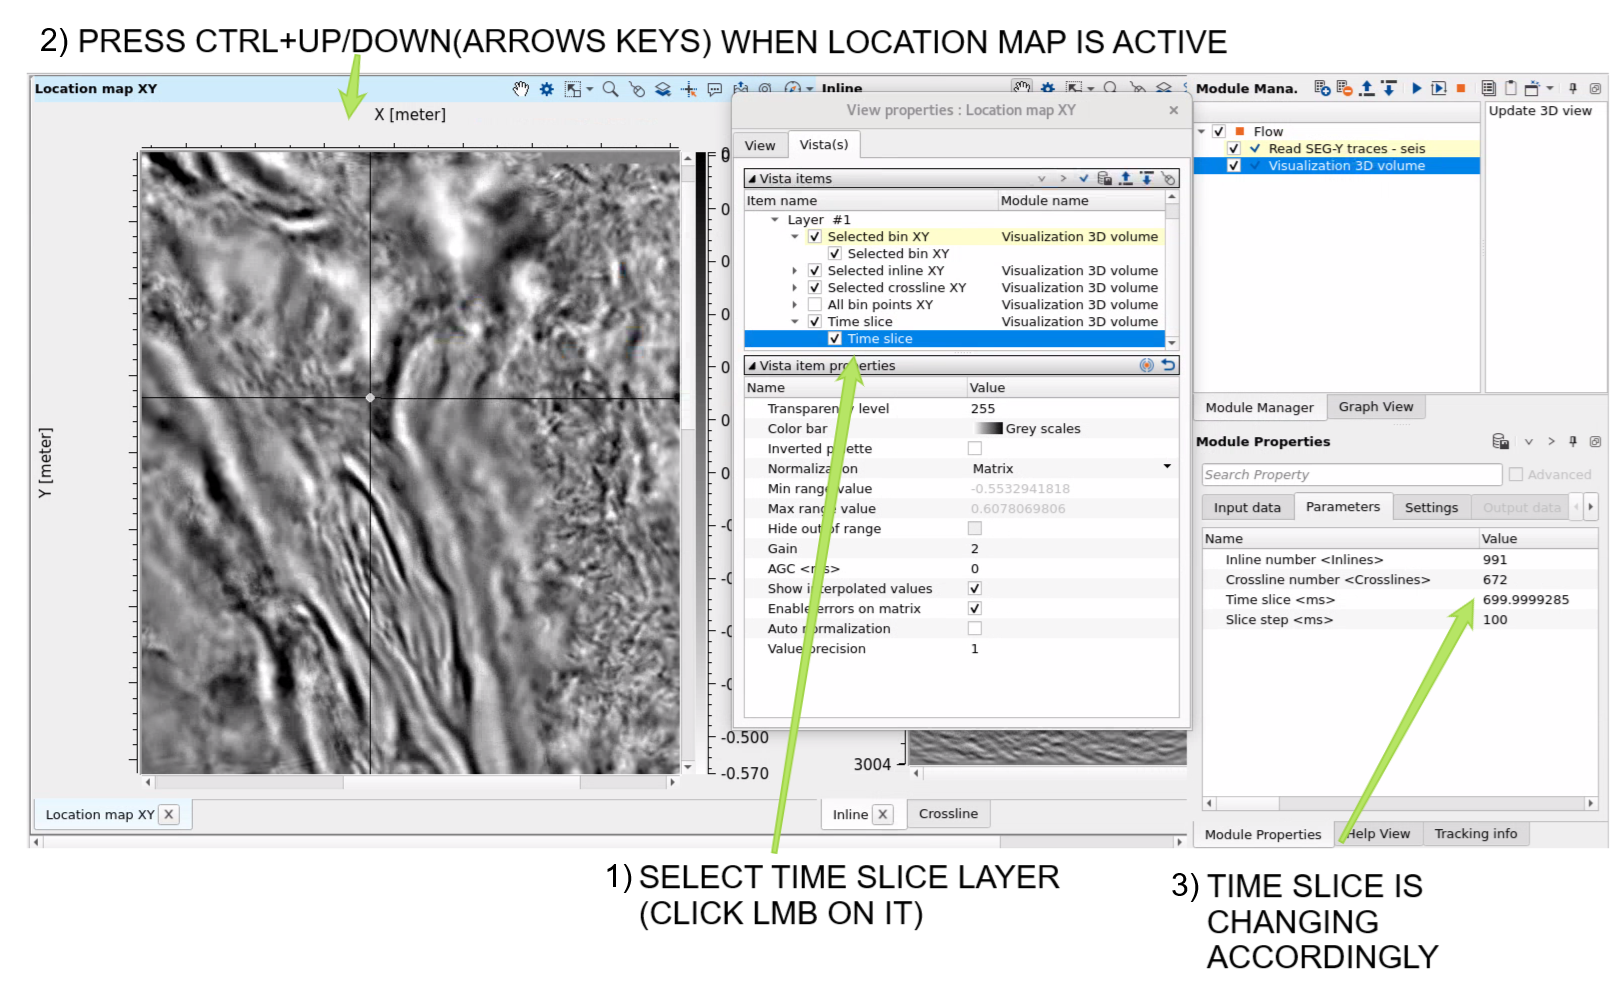
Time slice - define slice depth/time for selection.
Slice step - define step depth/time for slice auto selection on the Location map: use ctrl+up(down):
![]()
![]()
Skip - switch-off this module (do not use in the workflow).
![]()
![]()
There is no output data sets (only visual 3D vista items for QC).
![]()
![]()
Update 3D view - update visual vista items in case of new input gather, or just rerun the module.
![]()
![]()
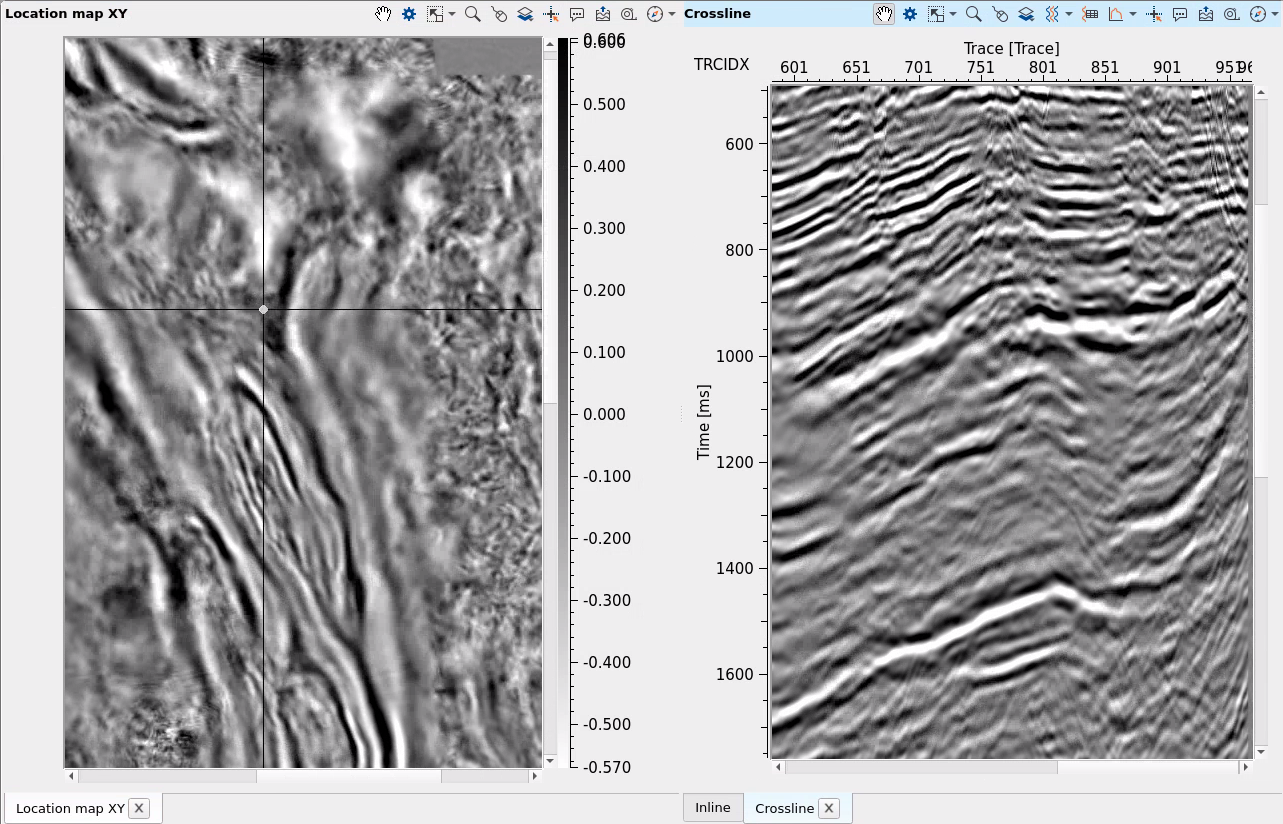
Workflow example:
Open 3 visual vista items from the module (RMS on module -> Vista groups -> ....) Location map, Inline and Crossline, use mouse for making inline and crossline selection by clicking on the location map:
![]()
![]()
YouTube video lesson, click here to open [VIDEO IN PROCESS...]
![]()
![]()
 * * * If you have any questions, please send an e-mail to: support@geomage.com * * *